Real-time Visitor Dashboard
Today's Arrivals
1,247
+12.3% vs yesterdayThis Month
38,542
+18.7% vs last monthPeak Season
Jun-Aug
32.8% of annual visitorsAvg. Stay
8.2 days
+0.8 days vs 2023Visitor Arrivals Trend Analysis
Monthly Visitor Arrivals (2023-2024)
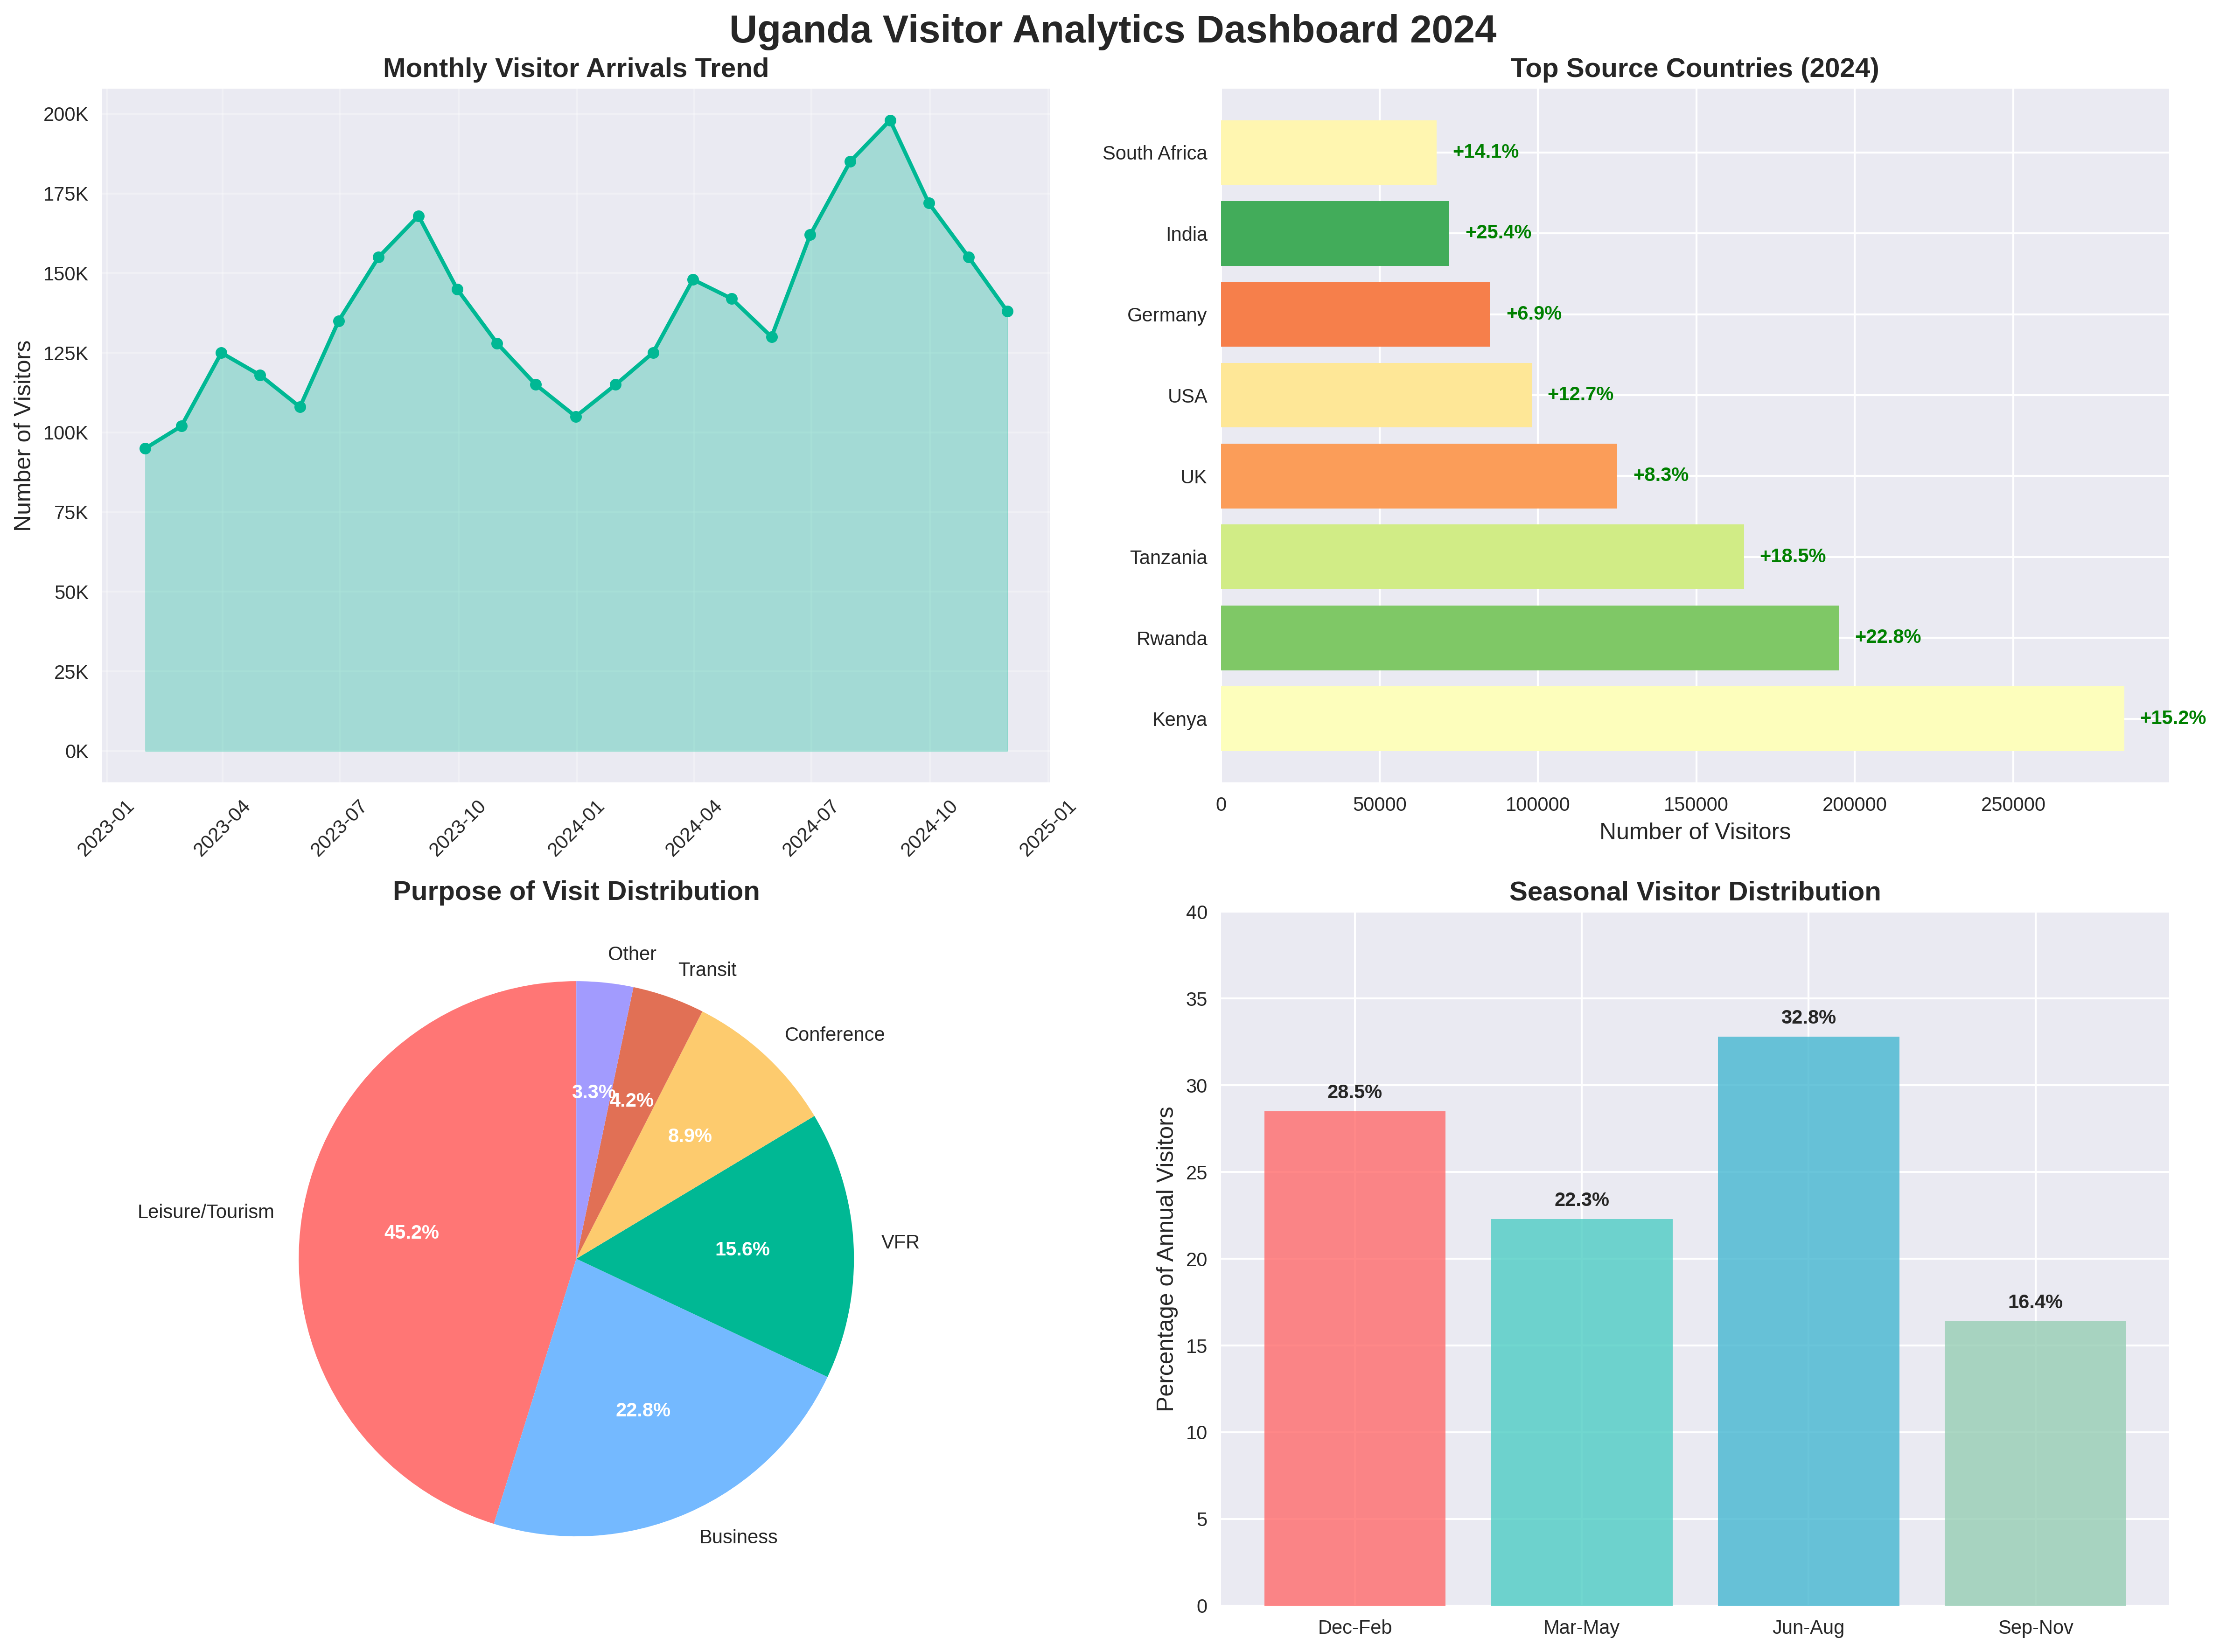
Uganda's visitor arrivals have shown consistent growth throughout 2024, with particularly strong performance during the peak tourism seasons. The data reveals clear seasonal patterns and recovery trends.
Peak Month
Highest Growth
Monthly Performance Comparison
| Month | 2023 Arrivals | 2024 Arrivals | Growth Rate | Market Share |
|---|---|---|---|---|
| January | 95,000 | 115,000 | +21.1% | 6.9% |
| February | 102,000 | 125,000 | +22.5% | 7.5% |
| March | 125,000 | 148,000 | +18.4% | 8.9% |
| April | 118,000 | 142,000 | +20.3% | 8.5% |
| May | 108,000 | 130,000 | +20.4% | 7.8% |
| June | 135,000 | 162,000 | +20.0% | 9.7% |
Source Countries Analysis
Top Source Markets 2024
Uganda attracts visitors from diverse global markets, with East African countries leading due to regional integration and the East Africa Tourist Visa. European and North American markets show strong growth potential.
Kenya
East AfricaRwanda
East AfricaTanzania
East AfricaUnited Kingdom
Europe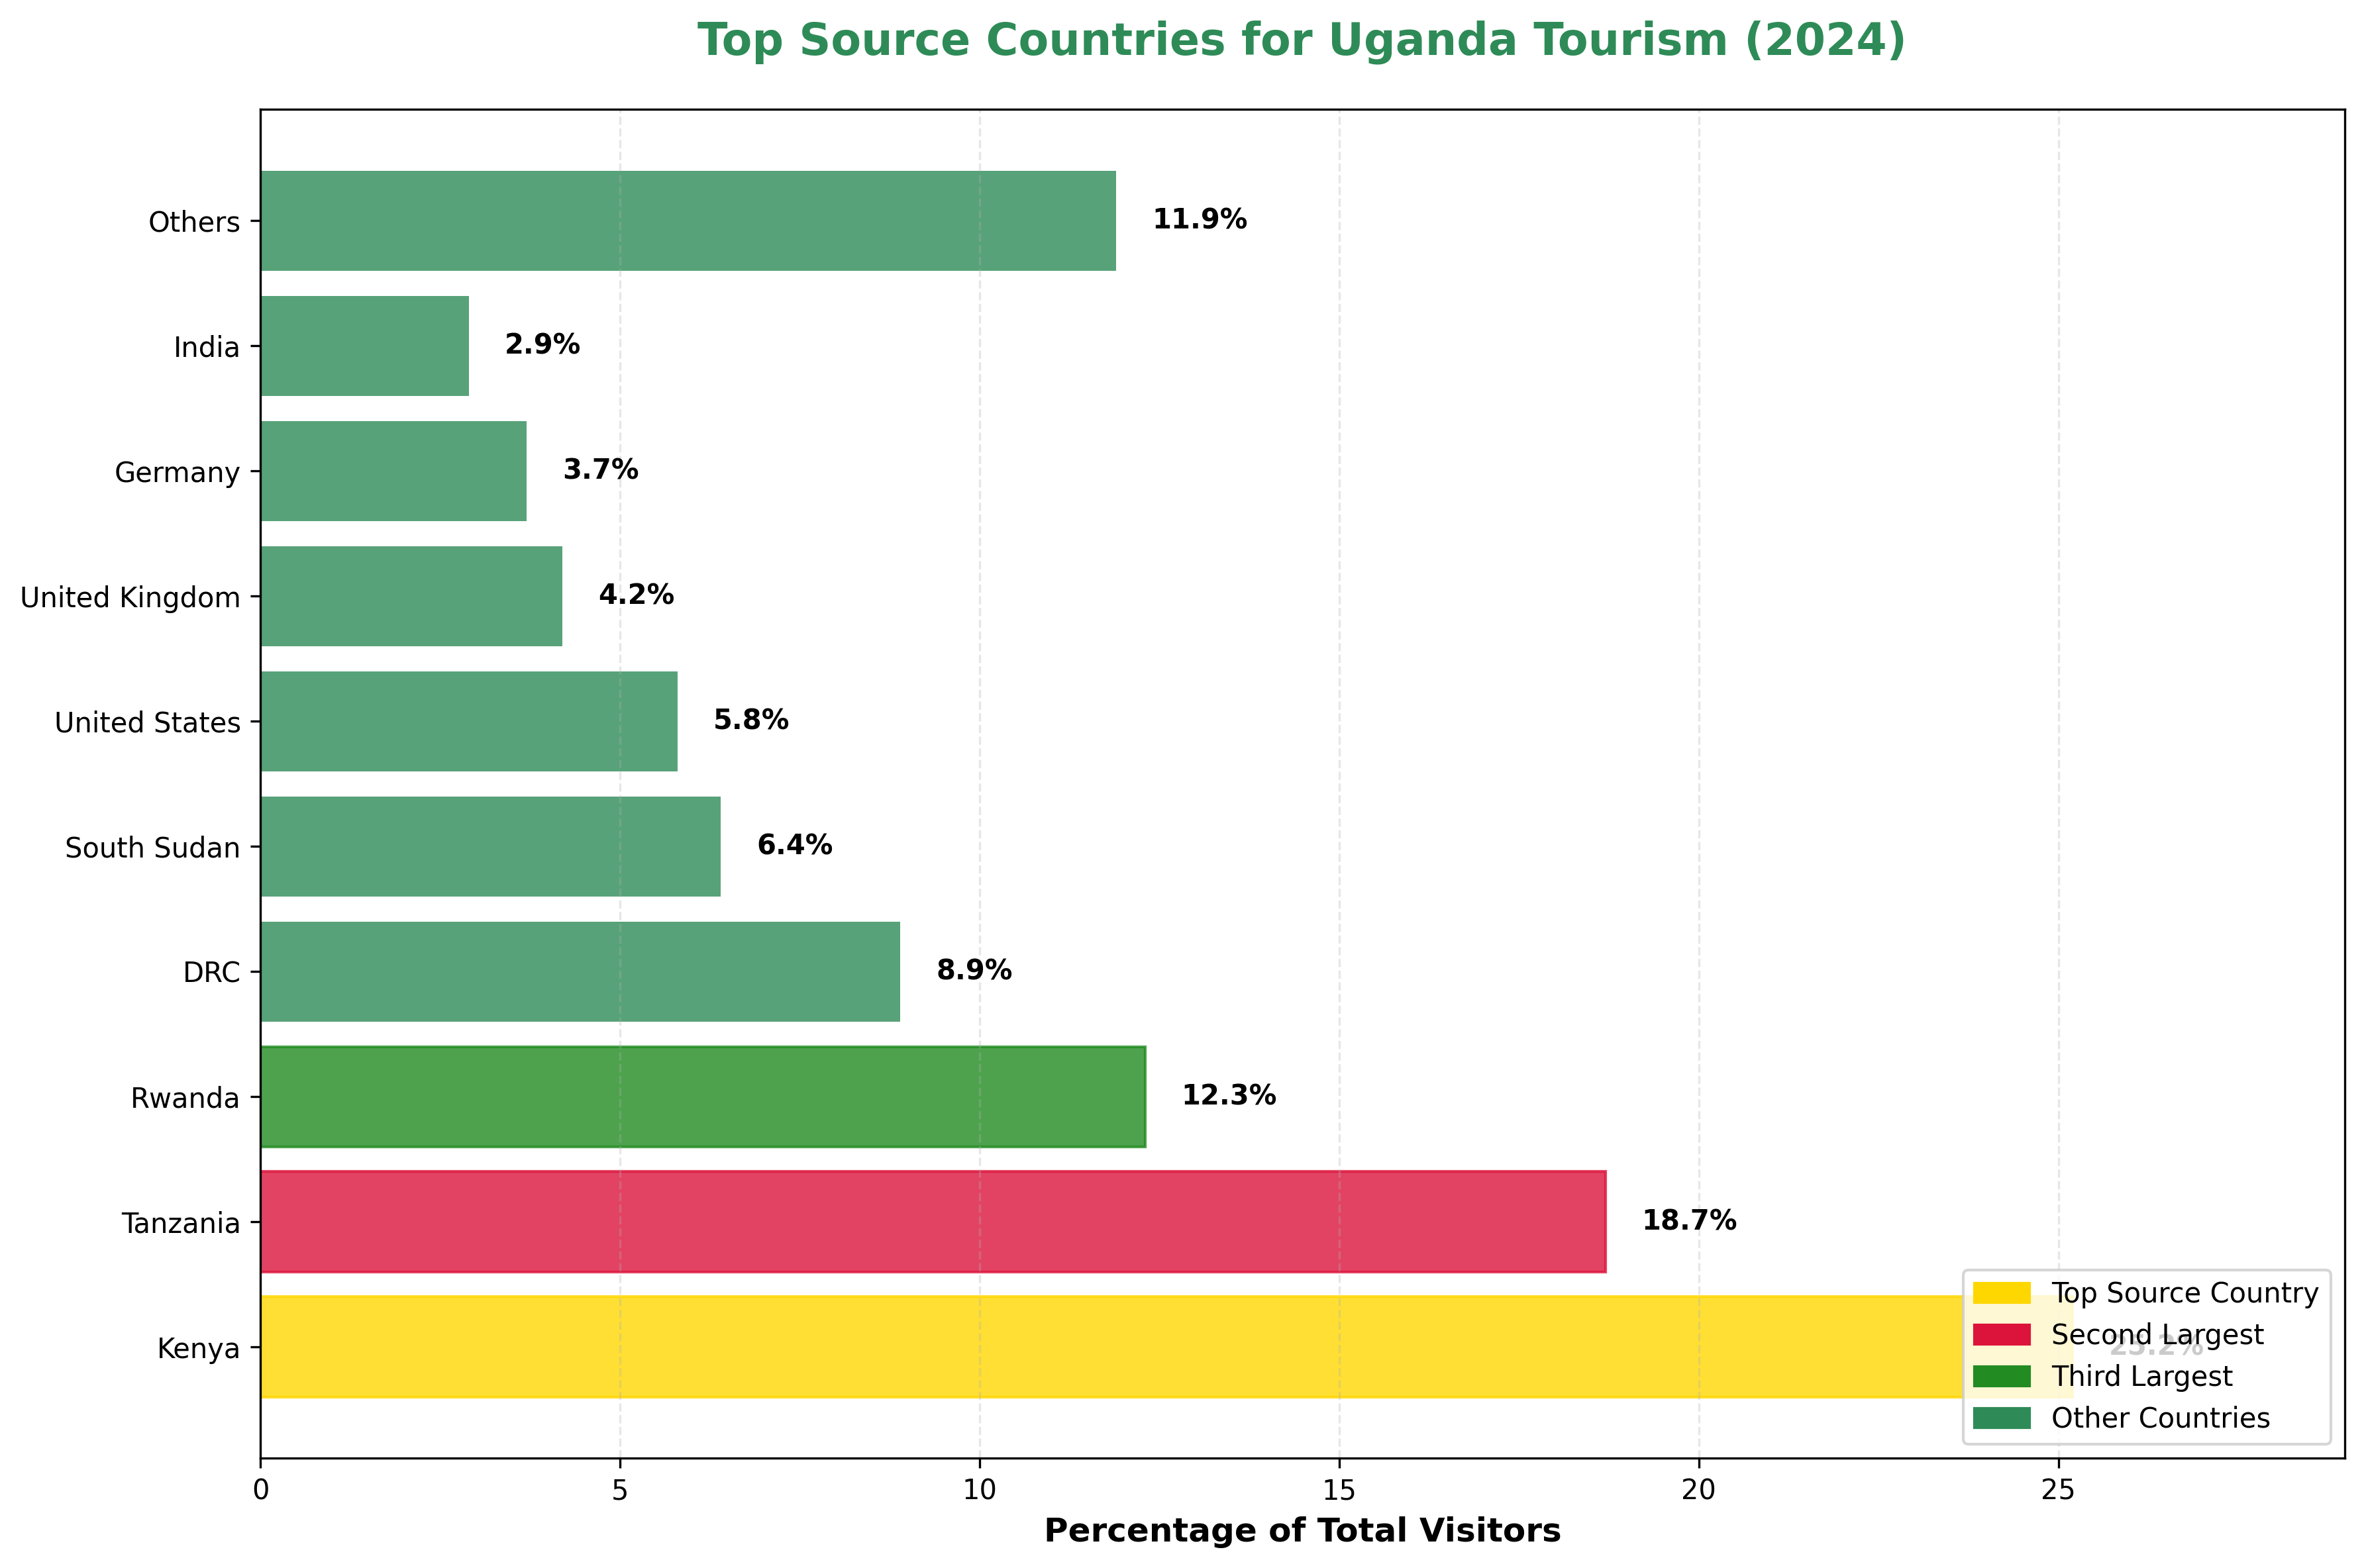
Regional Market Distribution
52.8%
East Africa
22.5%
Europe
12.8%
North America
11.9%
Other Regions
Purpose of Visit Analysis
Visitor Motivation and Travel Patterns
Understanding why visitors come to Uganda helps in developing targeted marketing strategies and improving service delivery. Leisure tourism dominates, followed by business travel and visiting friends and relatives (VFR).
Leisure/Tourism
Wildlife, culture, adventureBusiness
Meetings, conferences, tradeVFR (Visiting Friends/Relatives)
Personal visits, familyConference/Events
MICE tourismTransit
Connecting flightsOther
Education, medical, etc.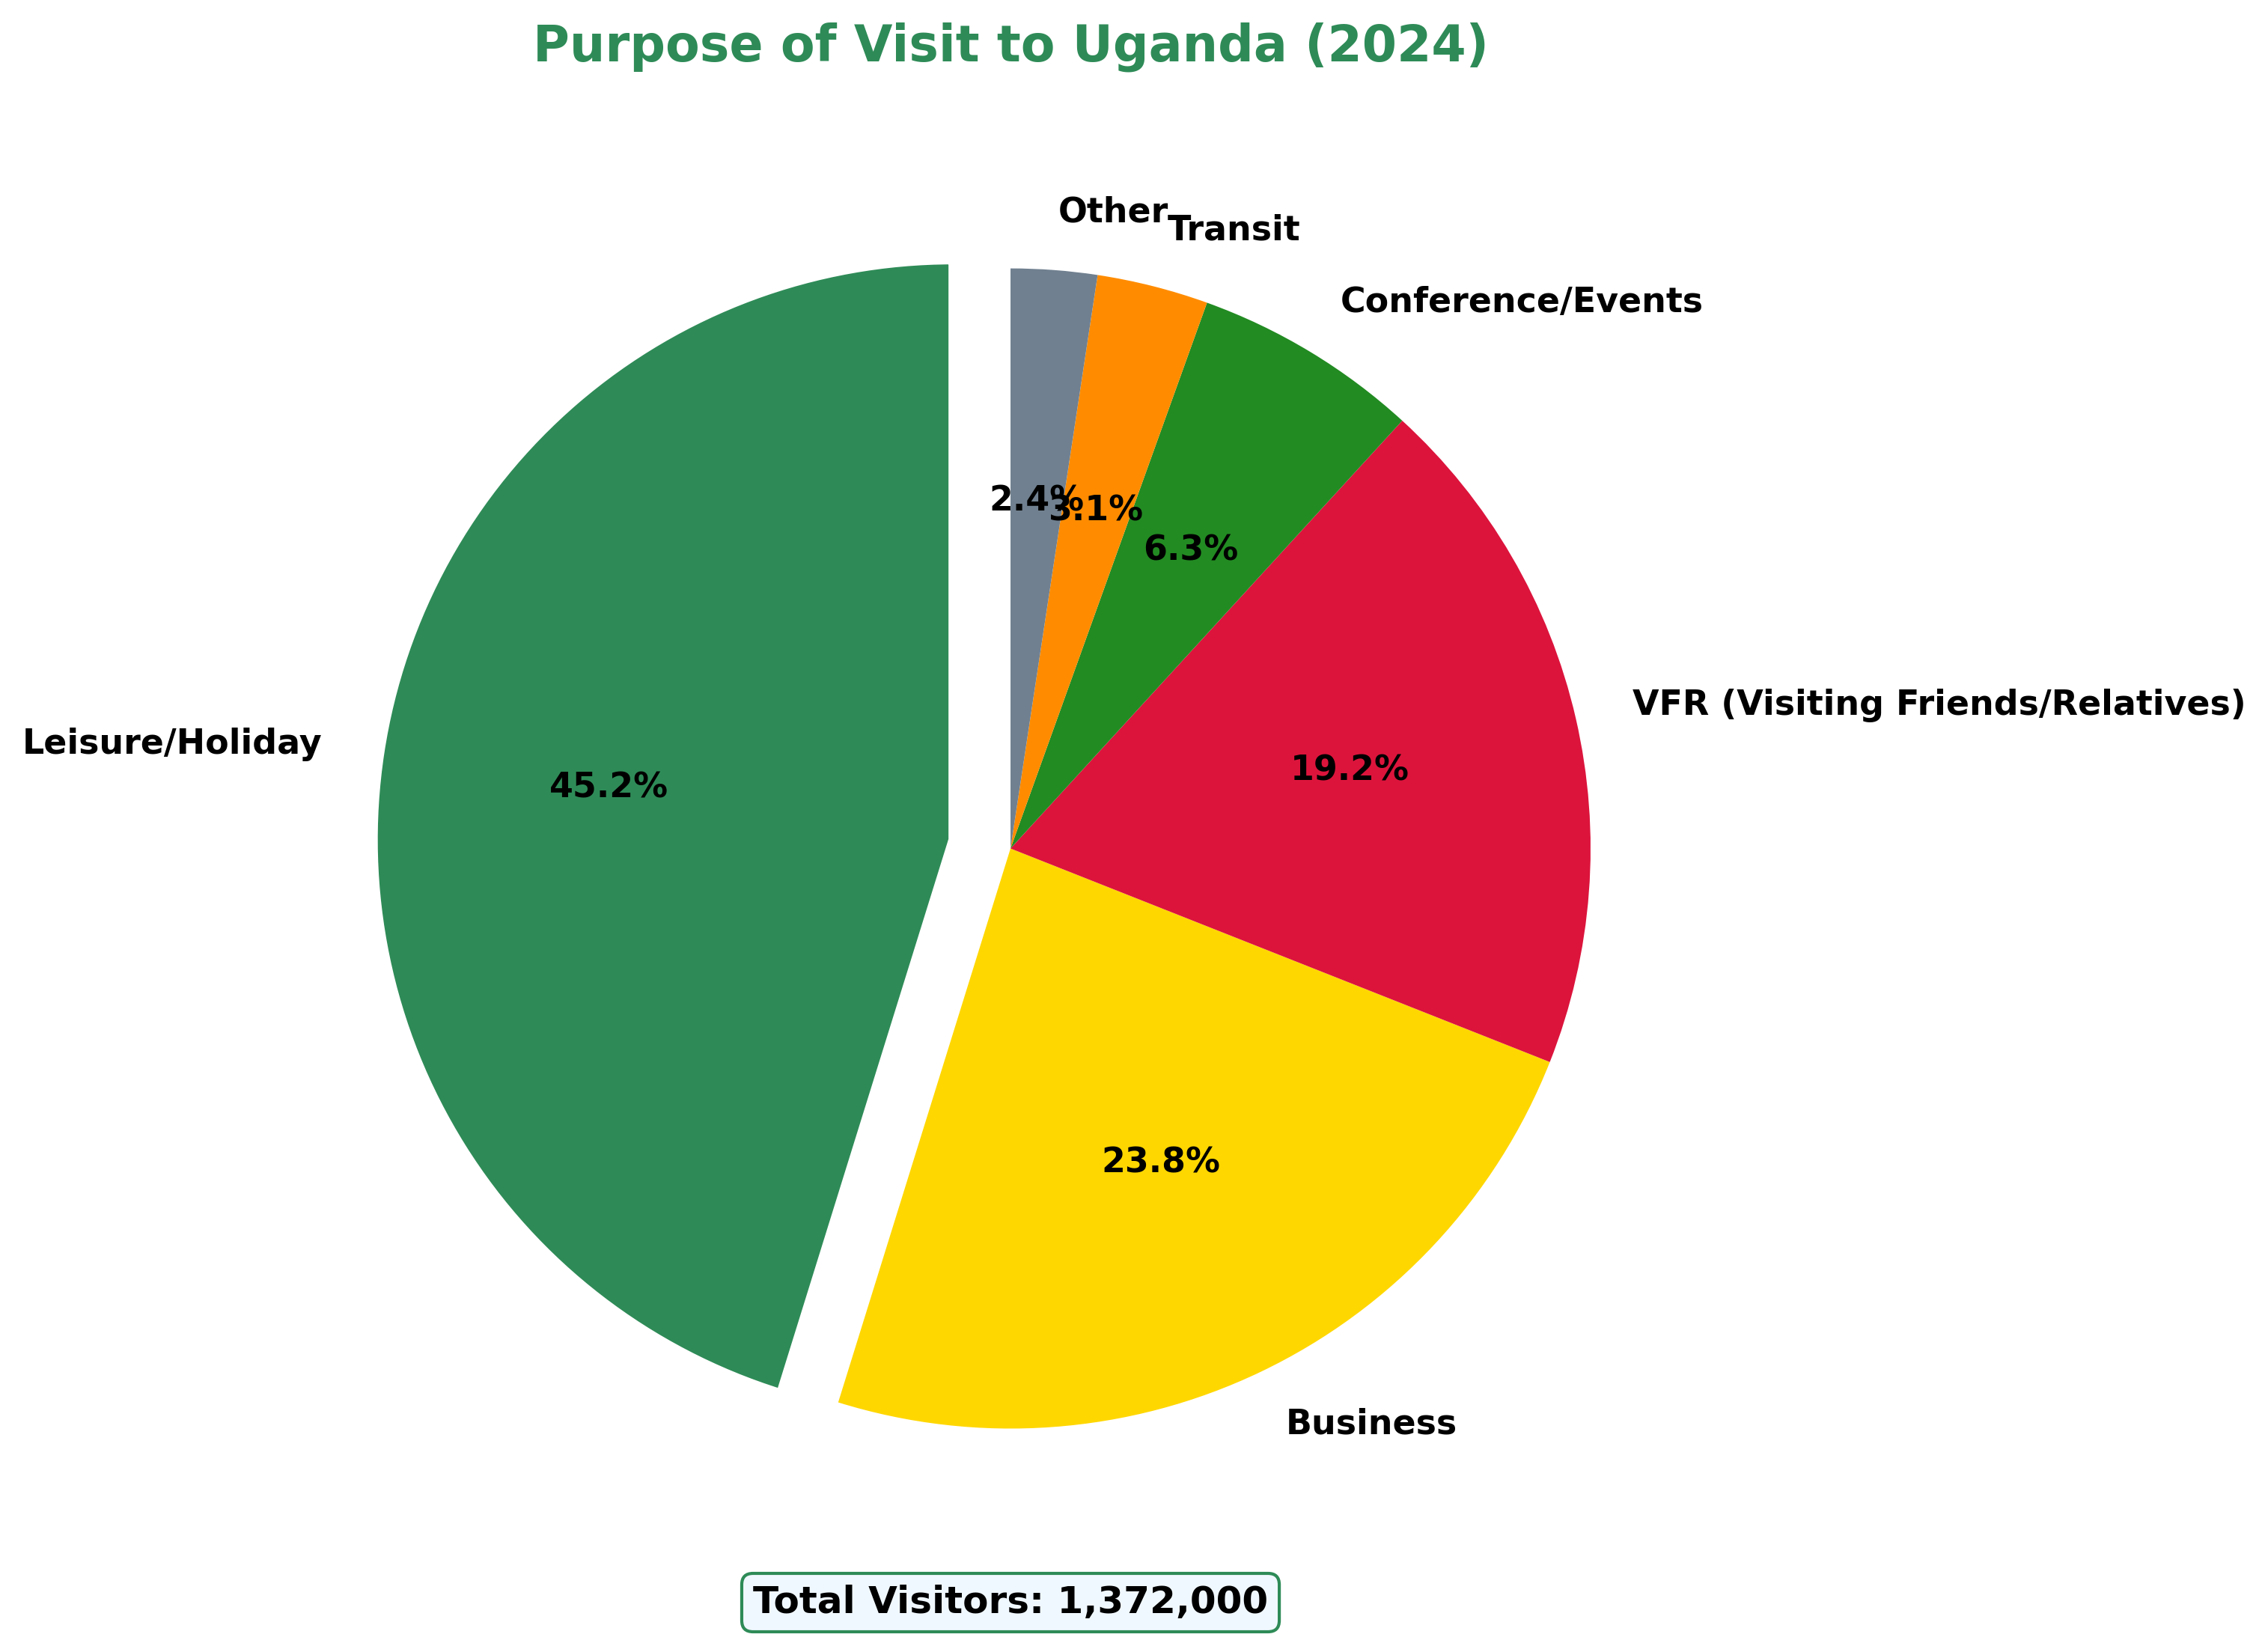
Seasonal Visitor Patterns
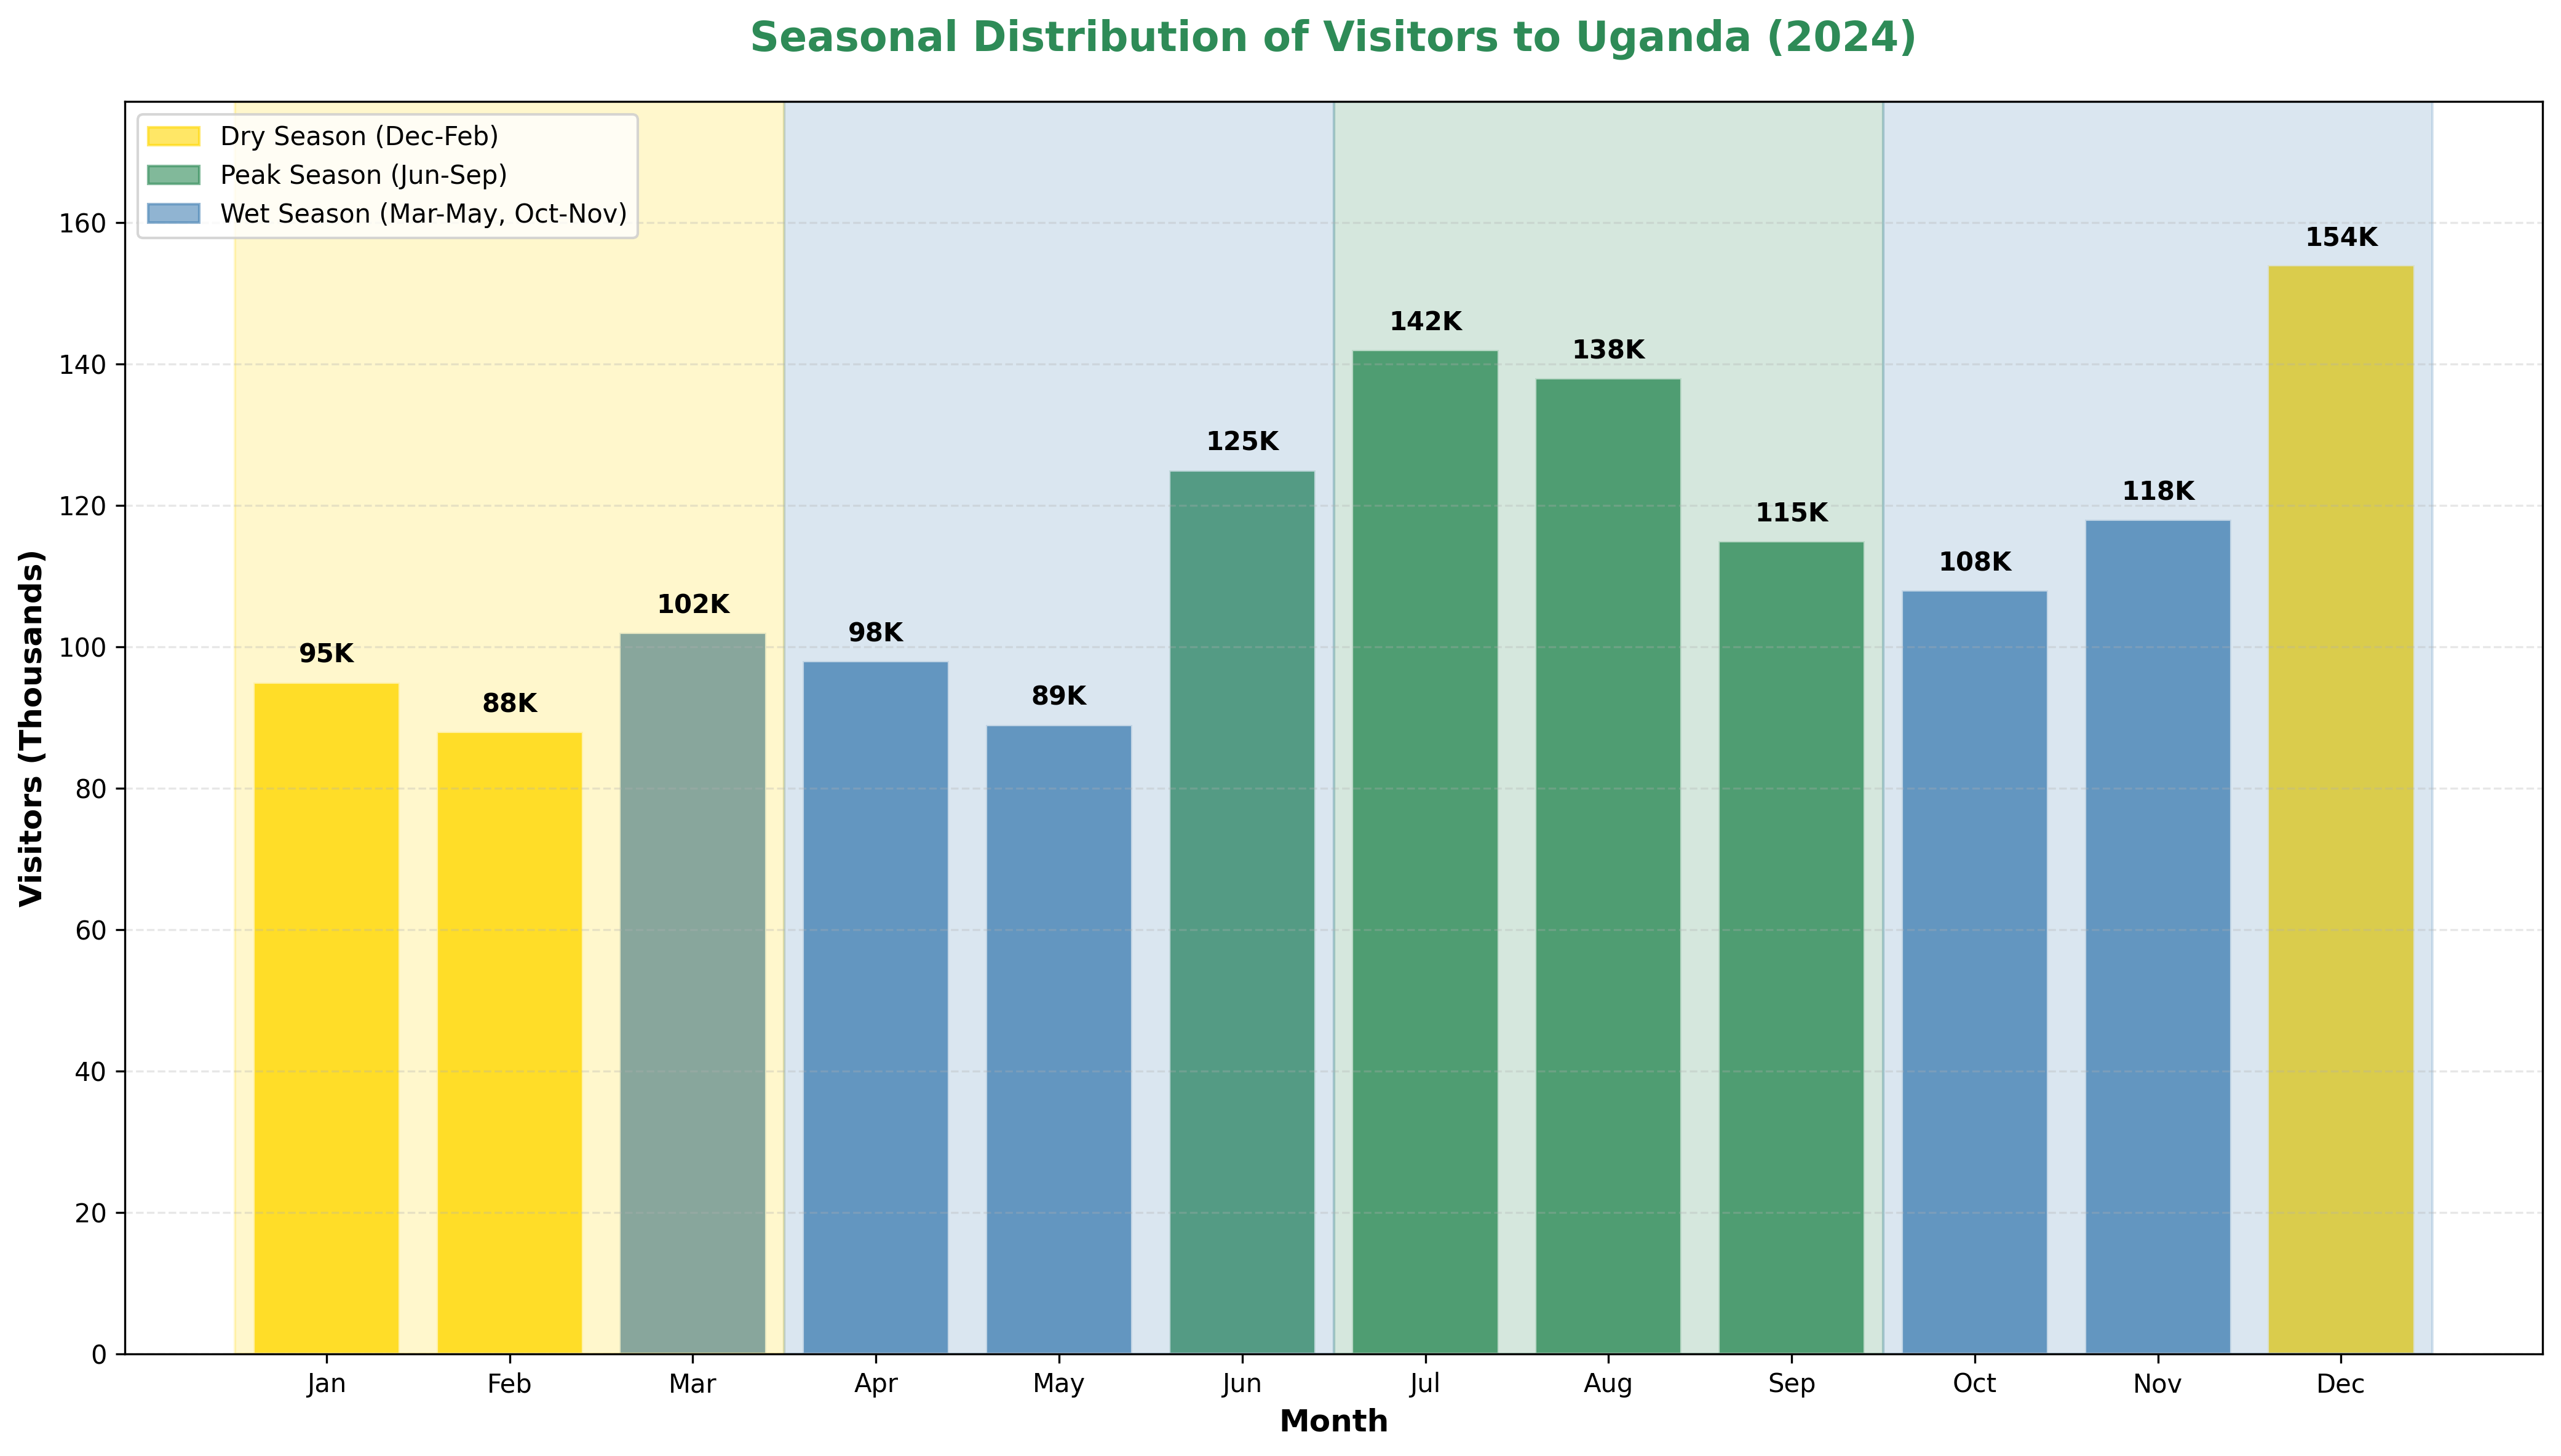
Seasonal Distribution Analysis
Uganda's tourism shows distinct seasonal patterns influenced by weather conditions, wildlife viewing opportunities, and international holiday periods. Understanding these patterns helps in capacity planning and marketing strategies.
Key Seasonal Insights
- Peak Season (Jun-Aug): 32.8% of annual visitors
- High Season (Dec-Feb): 28.5% of annual visitors
- Shoulder Season (Mar-May): 22.3% of annual visitors
- Low Season (Sep-Nov): 16.4% of annual visitors
Factors Influencing Seasonal Patterns
Weather Conditions
Dry seasons (Dec-Feb, Jun-Aug) are preferred for wildlife viewing and outdoor activities.
Wildlife Viewing
Gorilla trekking and safari activities are optimal during dry seasons with better accessibility.
International Holidays
European and North American holiday periods drive peak season demand.
Pricing Strategies
Dynamic pricing during peak seasons helps manage demand and maximize revenue.
Visitor Demographics Profile
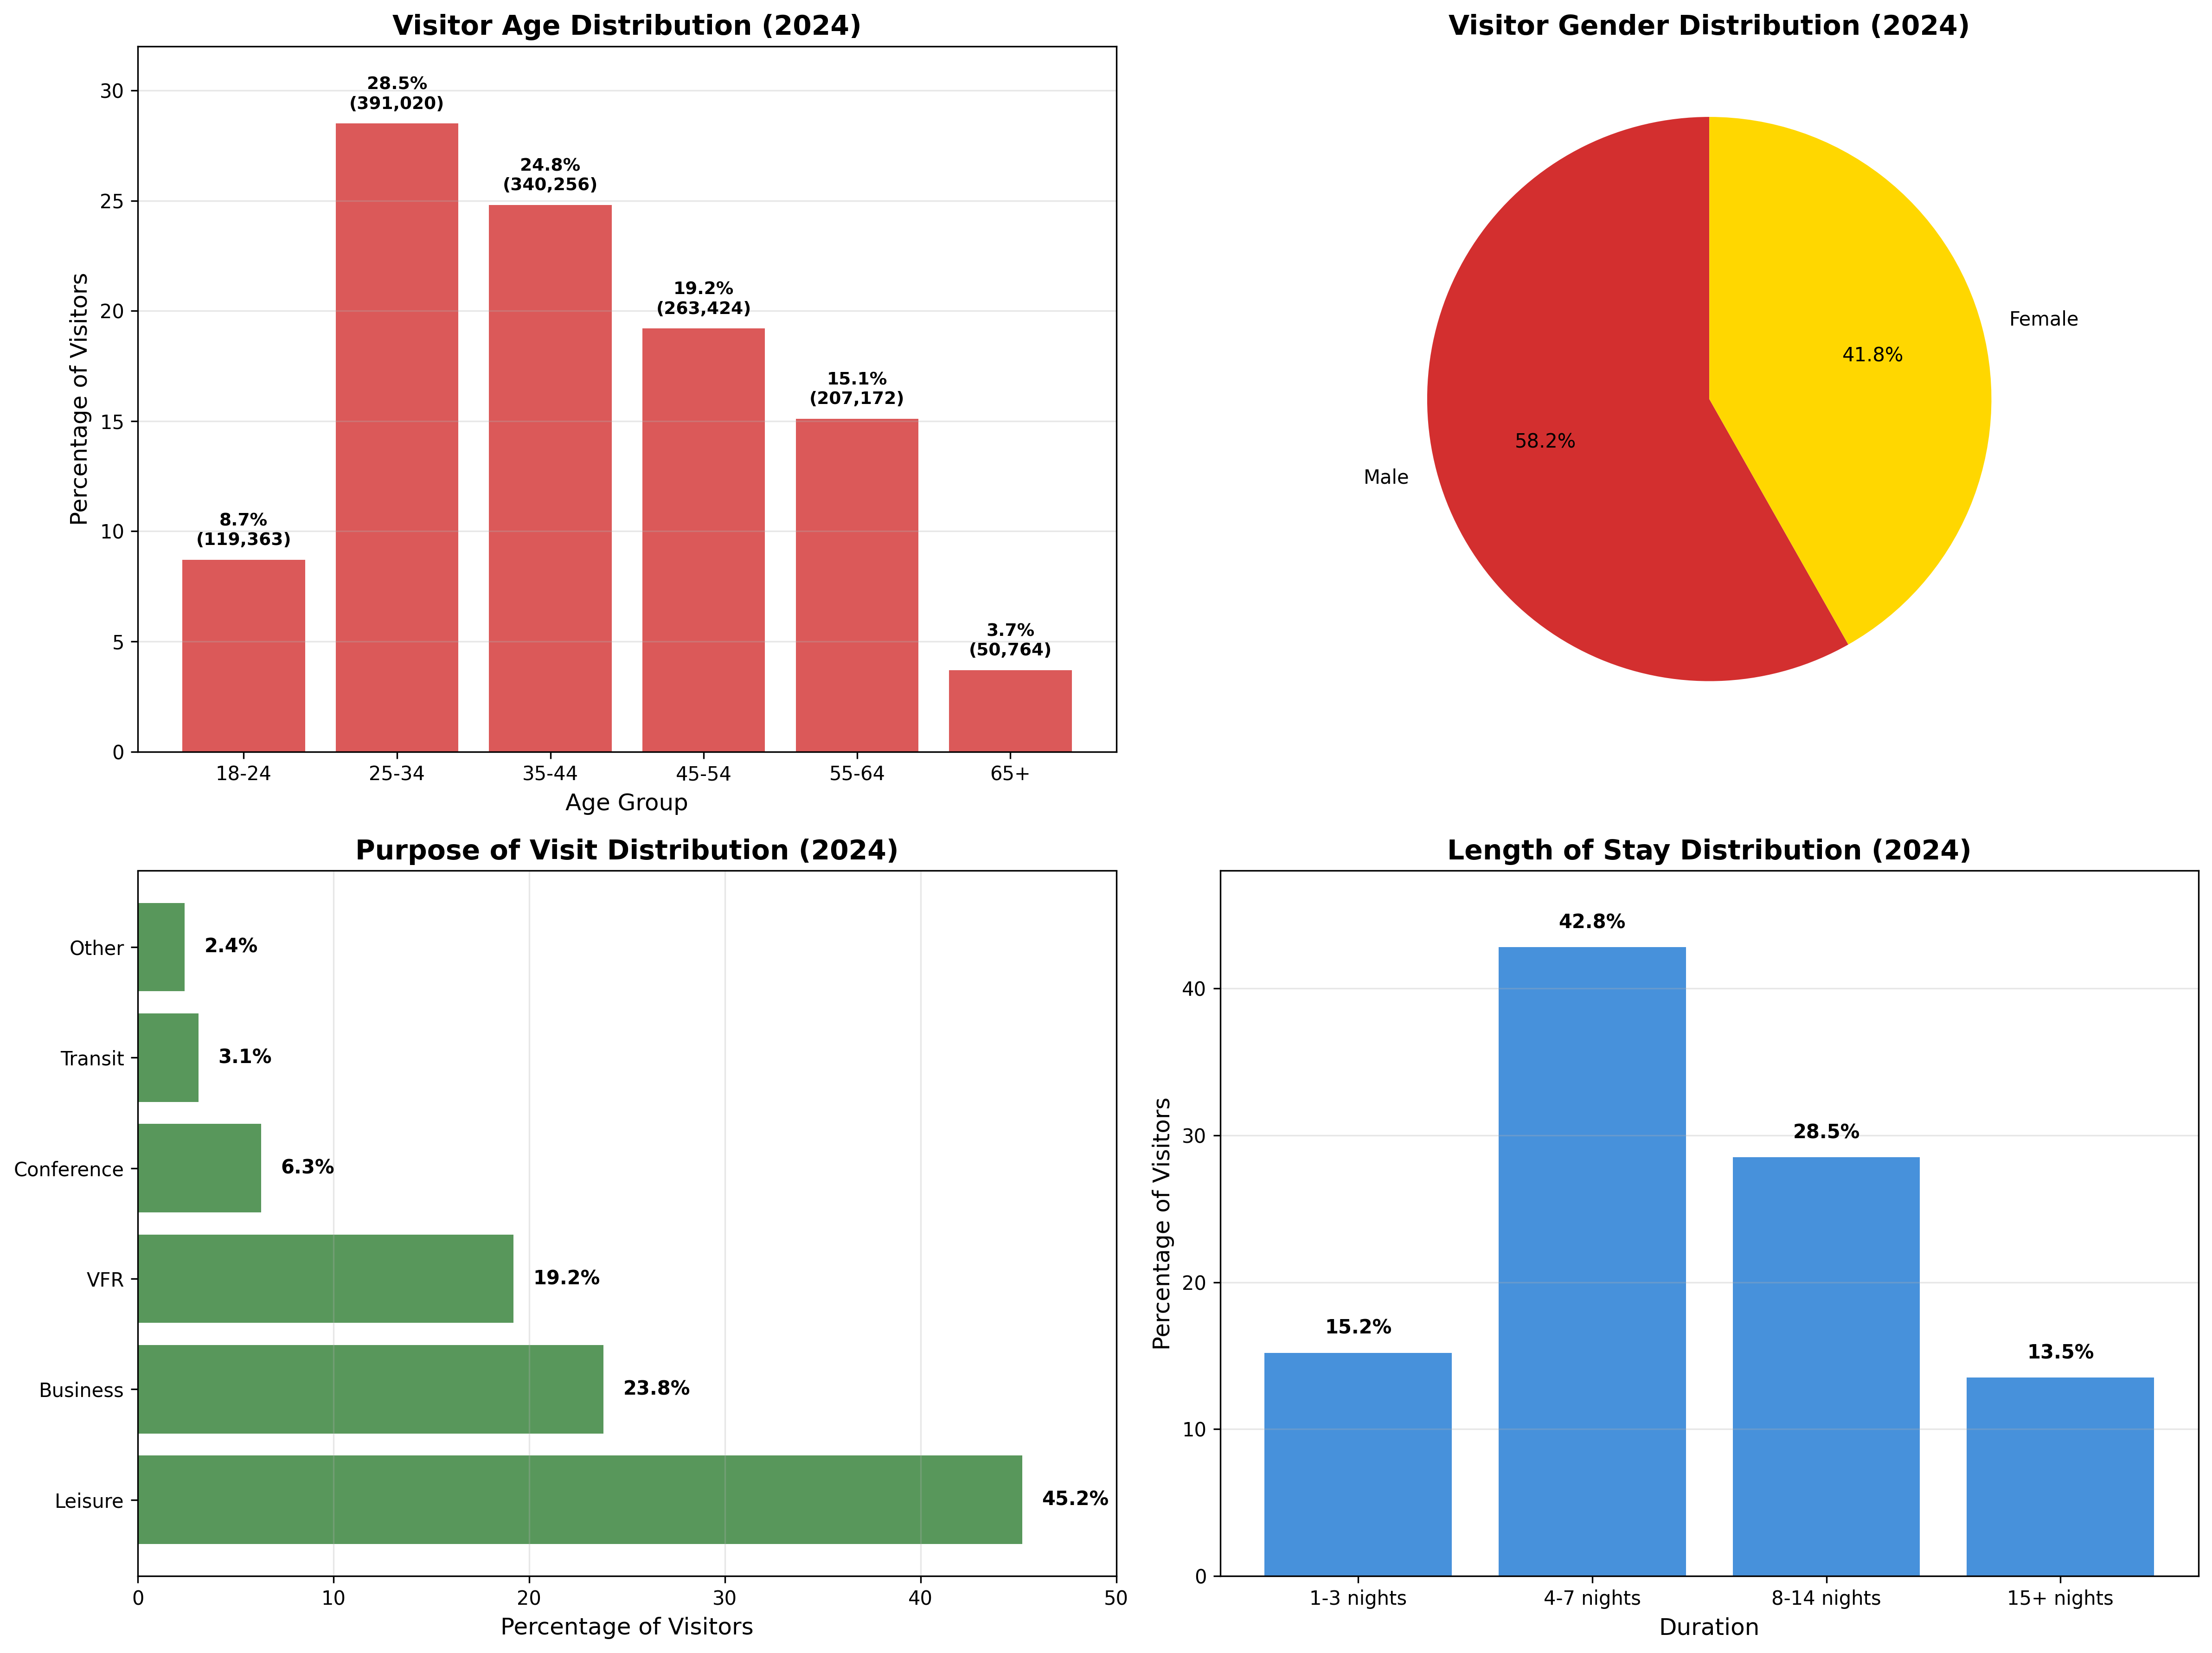
Demographic Characteristics
Uganda attracts a diverse visitor profile with varying demographics across different market segments. Understanding these characteristics helps in product development and targeted marketing.
Age Distribution
Gender Distribution
Travel Group Size
Income Level
Market Insights and Trends
Growth Trends
- • Digital nomad segment growing 45% annually
- • Adventure tourism up 32% in 2024
- • Sustainable tourism interest increased 28%
- • Repeat visitors grew by 22%
Emerging Opportunities
- • Wellness and eco-tourism segments
- • Extended stay programs
- • Cultural immersion experiences
- • Multi-country East Africa packages
Join Uganda's Growing Tourism Success Story
Be part of the 1.67 million visitors who chose Uganda in 2024. Apply for your eVisa and experience the Pearl of Africa.